Retail, Commerce & Consumer Brands · Data-Driven Dashboards Across Regional Operations
Data-Driven Dashboards Across Regional Operations
Giving regional teams clearer visibility into performance, planning, and operational decisions
The Client · A global sportswear brand
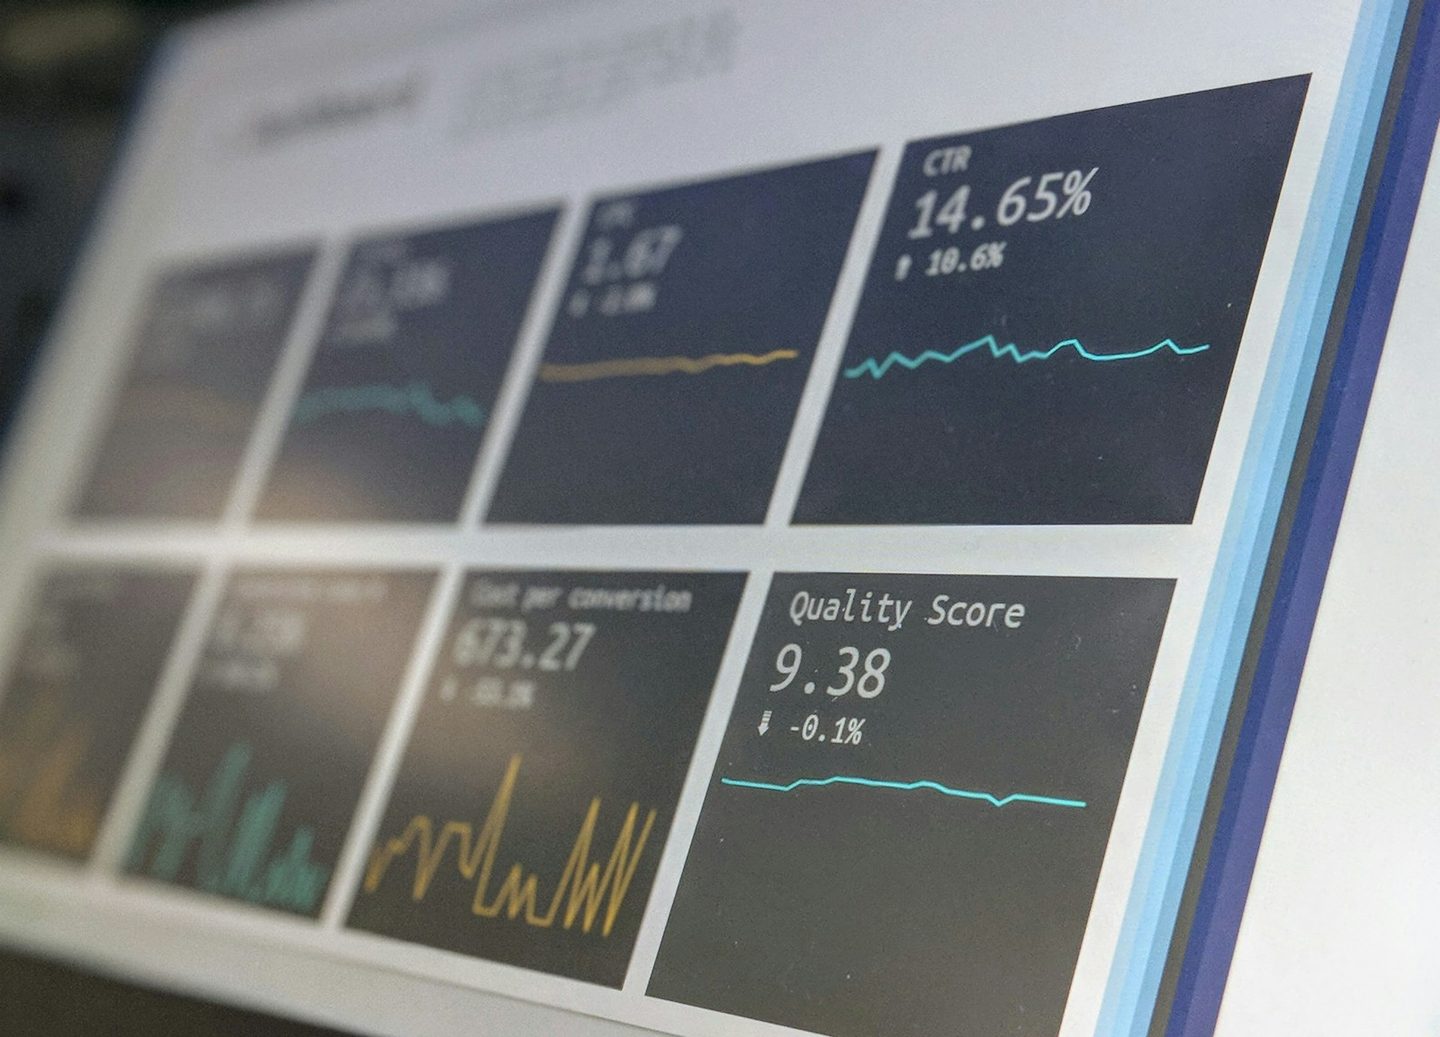
Overview
A global sportswear brand engaged Taller to consolidate its scattered North America and Latin America operational data into a single Power BI reporting layer.
The Problem
The client’s operational data was scattered across ServiceNow, SharePoint, and assorted Excel extracts in both North America and Latin America, producing a fragmented, delayed reporting picture. Decision-makers in either region often waited days for a clear view of what was happening, which was far too slow to actually change how the business ran.
The Solution
Taller’s solution connected the client’s operational systems to a reporting layer leadership could actually use. The team pulled data out of ServiceNow (the client’s incident-and-request system) and channeled it through Power Query and SharePoint into Power BI dashboards. The core engineering challenge was the handoff between ServiceNow’s operational data and the reporting tools consuming it, and Taller solved it on two fronts: Power Query reshaped the raw operational data into an analytical form the dashboards could read, while SharePoint gave business owners a place to manage their own reference data, so routine changes no longer waited on an engineer. On top of that foundation, Taller built the dashboards themselves with layered measures, time-based comparisons across fiscal periods, and region-specific logic, because the questions a regional VP needed answered rarely fit into a single chart.
The Impact
The new dashboards gave leadership across both regions real-time operational insight, letting decisions move at the pace the business actually needed.